
The sensing system
The survey system for geodetic monitoring consists of two components: a satellite component and an in situ component.
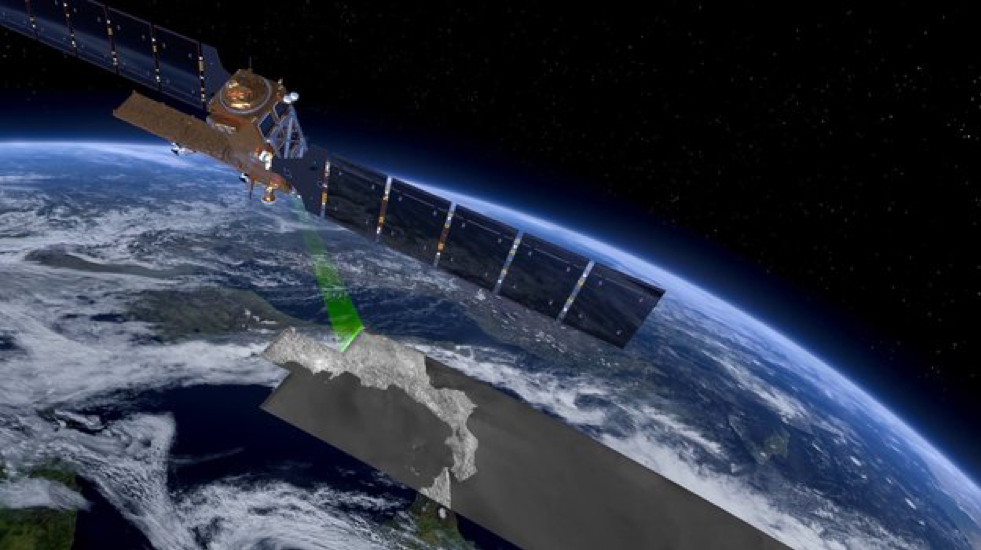
The satellite component uses data acquired by radar systems mounted on satellites orbiting several hundred kilometres from Earth (Figure 1), capable of providing high-resolution microwave images. These systems are called “SAR”, which stands for synthetic aperture radar. Due to their longer wavelength than those of visible and infrared radiation, microwaves have the important property of penetrating through clouds, fog and possible coverings of ash or dust (for example, in the case of a volcanic eruption or collapse of a building); they are also independent of lighting conditions (day or night), thus allowing monitoring under any weather and environmental conditions.
The analysis of surface deformations in the Cornegliano Laudense area has been carried out using both archived SAR data, which allow observing the “past” history of ground movements in the area of interest, and recently acquired data, which monitor the current evolution of surface deformations.
As far as archived data are concerned, SAR images collected by the ERS-1/2 and ENVISAT sensors of the European Space Agency (ESA) over an area of approximately 95 km x 60 km, including the Cornegliano Laudense site, during the period 1993-2010, were used together. In particular, the deformation analysis was conducted using 141 images acquired by satellites along descending orbits (the satellite moves from north to south) and 76 along ascending orbits (the satellite moves from south to north).
With respect to monitoring, the analysis of surface deformations is carried out using data collected from the Sentinel-1 (S-1) constellation of the Copernicus European Programme, which is composed of twin sensors called S-1A and S-1B, which allow SAR images to be acquired every 6 days in the area of interest (Figure 1). In particular, 191 S-1 SAR data acquired from descending orbits and 200 from ascending orbits have been used over an area of approximately 190 km x 70 km that includes the site of Cornegliano Laudense from March 2015 through the present.
The analyses carried out based on satellite data are integrated with those conducted through the network of GNSS stations to bind the satellite measurements to some points located on the ground, for which the positions are known with precision.
What is measured
The technique called “differential interferometry SAR” (DInSAR) allows the measurement of ground displacements (subsidence, slippage, etc.) with an accuracy on the order of centimetres and, in some cases, millimetres over very large areas (tens of thousands of square kilometres). The DInSAR methodologies basically “compare” pairs of SAR images acquired by one or more sensors from approximately the same position but at different times for a given area of the Earth’s surface. If something has changed in the time interval between the two acquisitions, i.e., if ground deformation has occurred between the two sensor passes, this can be measured and displayed by means of a false colour map with a correspondence between colours and ground movement.
In addition, using advanced DInSAR techniques, by appropriately combining a sequence of SAR images acquired for the same area over time, the evolution of the surface deformation can be measured in the time interval considered. One of these techniques, called the small baseline subset (SBAS), allows the generation of ground deformation maps at medium and high spatial resolutions (tens of metres/metres) much denser spatially than traditional geodetic methods (geometric levelling campaigns or GPS measurements) and with increasing temporal frequencies.
It should be noted that the maps generated by DInSAR analysis measure the ground deformation projected along the sensor’s line of sight (referred to in English as line of sight, LOS); in essence, these maps involve measuring how far a point on the ground moves away from or closer to the sensor along its LOS. However, taking advantage of acquisitions made from both descending and ascending orbits, the results of the respective analyses can be combined to generate both maps (Figure 1) and time series of deformation for the vertical and east-west components of the detected displacements.
What DInSAR analyses represent
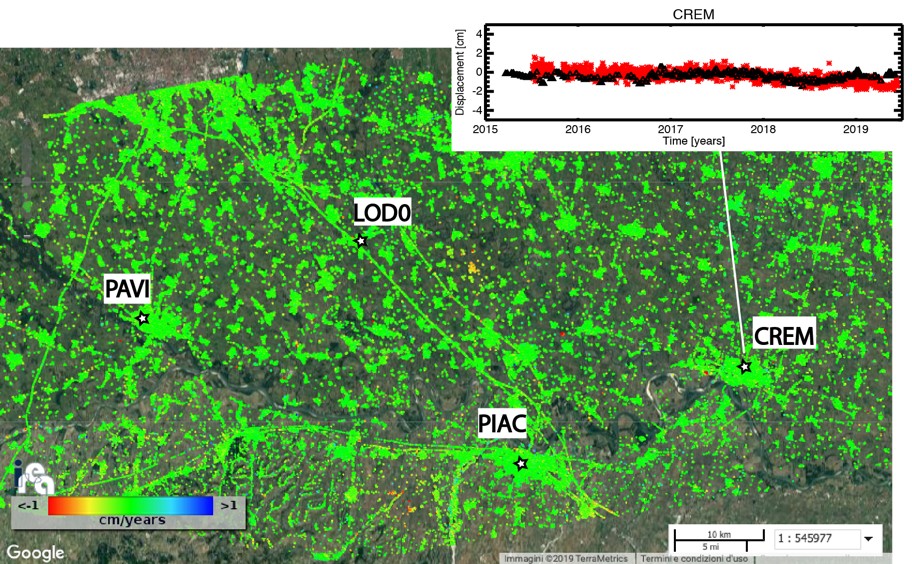
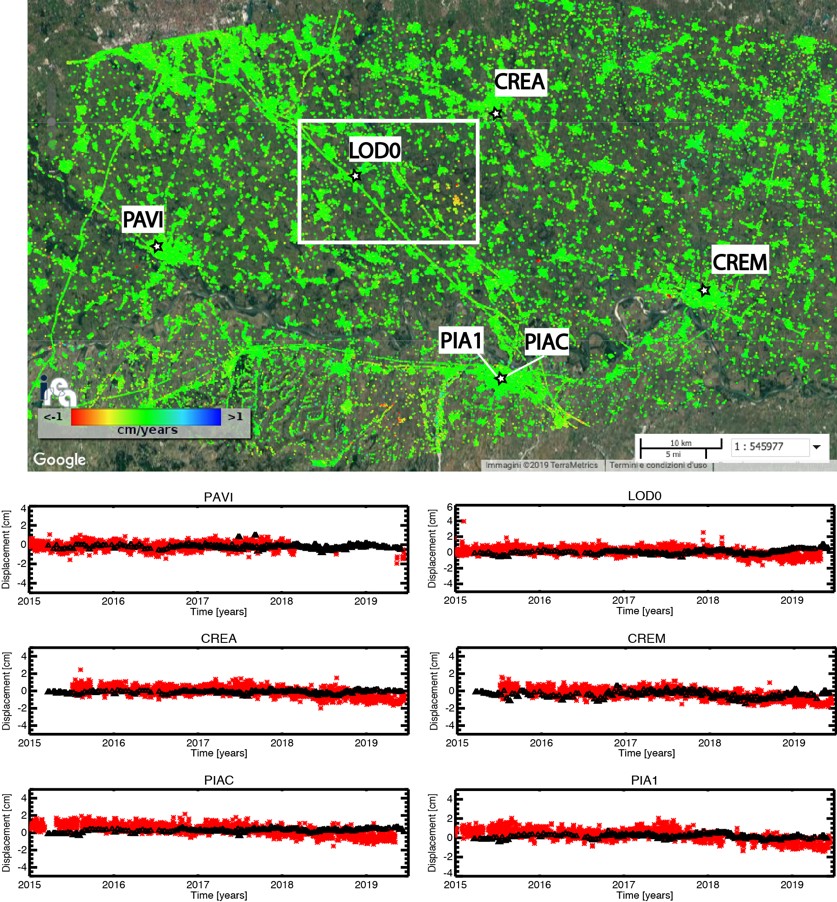
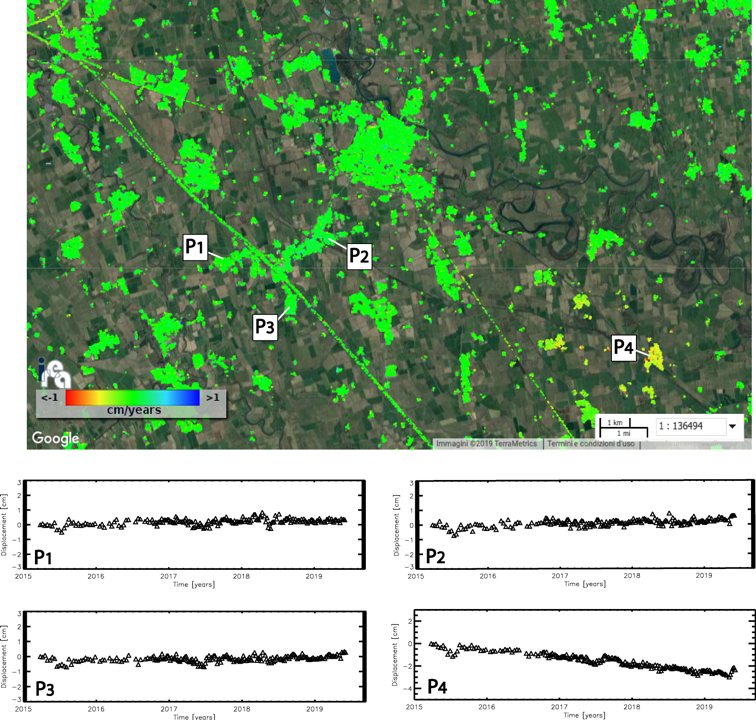
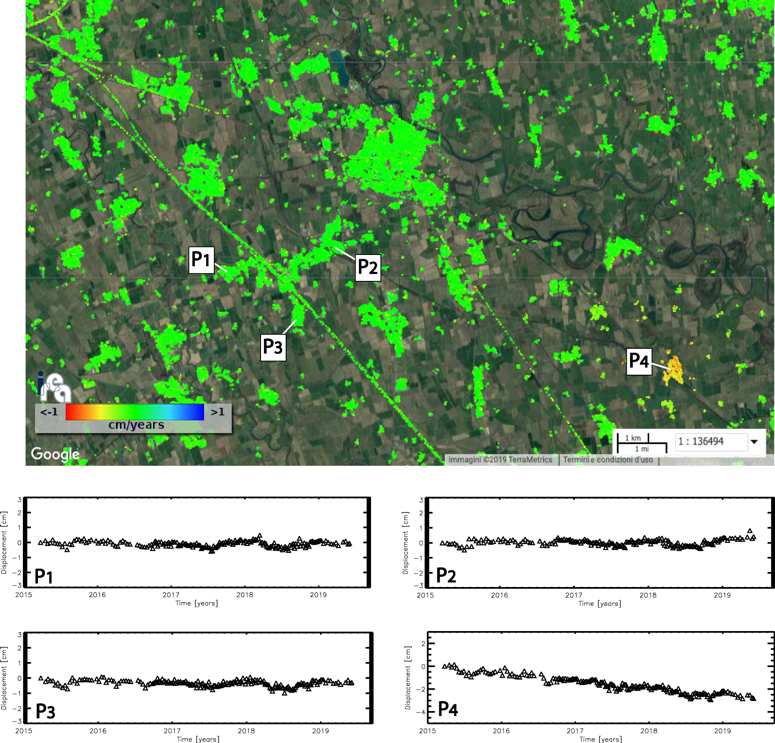
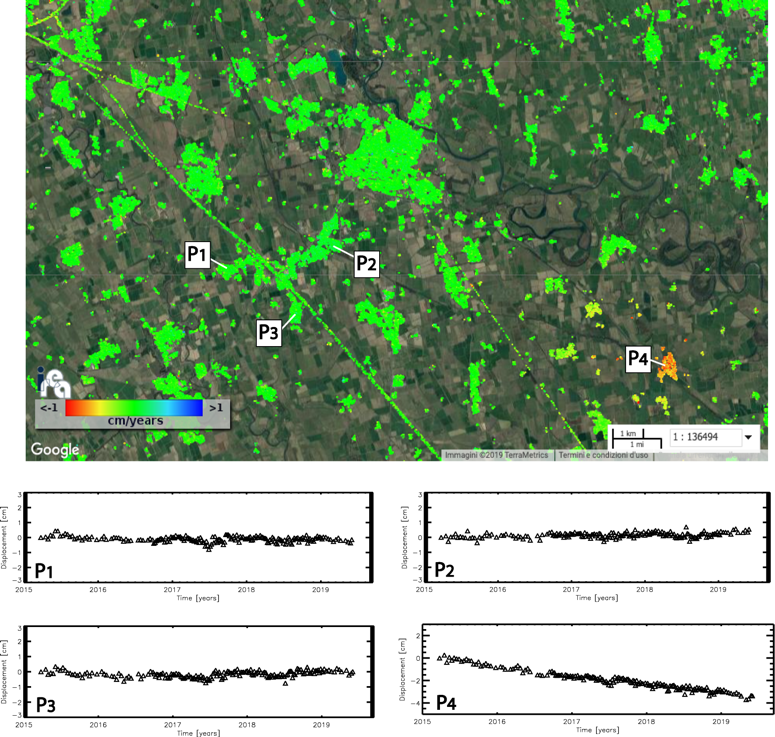
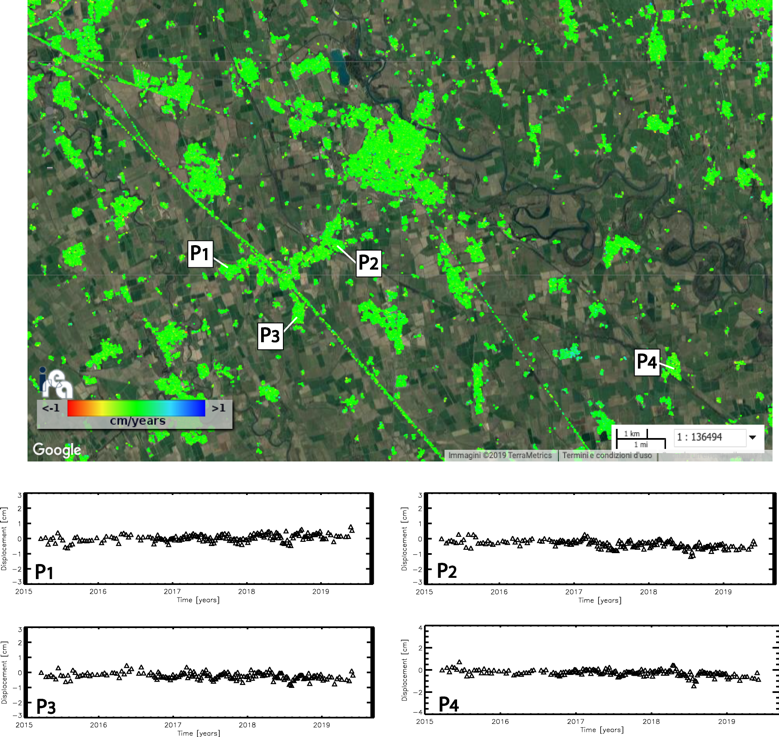
The main results of DInSAR analysis are the time series (also called historical series) of the ground deformation, typically measured in centimetres, and the related average deformation velocity maps calculated in cm/year, related to the time interval during which the data were acquired by the radar sensor and with a time frequency given by the time interval between two successive observations of the selected area on the ground.
The average ground deformation velocity maps are geocoded maps; therefore, they can be superimposed on existing maps of the area and are represented in false colours that correspond to the ground displacements. In these maps, only the points where the deformation measurement can be considered reliable are shown, and for each of these points, the historical deformation series is calculated.
The final spatial resolution of the ground deformation maps obtained by DInSAR analysis of Sentinel-1 data is approximately 30 m x 30 m, while their spatial extent is approximately 190 km x 70 km; the time sampling of the related historical deformation series is currently 6 days.
DInSAR measurements are differential measurements, i.e., relative measurements with respect to a point considered stable that is chosen as a reference. In our case, the reference point (also called the docking point) is a pixel located in the urban area of Pavia near a corresponding GPS station, which, as evidenced by the related GPS measurements, is not affected by deformation (see Figure 1).
The DInSAR analysis natively generates the measurement of the ground deformation projected along the sensor’s line of sight (LOS) (see Figure 2 and Figure 3); however, by combining the DInSAR results produced by analysis carried out with acquisitions along ascending and descending orbits, it is possible to obtain measurements of the vertical and east-west components of the ground displacements (see Figure 4 and Figure 5).
What is geodetic monitoring for
The activities of extraction/storage of hydrocarbons and re-injection of fluids into the sub-soil can induce surface deformation phenomena. These deformation effects provide important information about the characteristics of the sub-surface phenomena from which they originated and their temporal evolution. Geodetic monitoring aims to provide information on both the temporal trend of ground deformation and its spatial distribution in the analysed area, highlighting any variations with respect to the background deformation scenario, i.e., prior to the underground exploitation activities.